Supply Chain Mapping
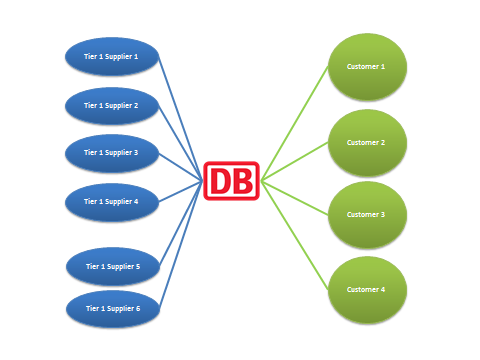
Proposal: if comprehension of DB’s supplier interaction is required, a diagram like the following will be useful. The diagram will depict DB’s suppliers and customers. The central entity is DB SR. Tier 1 suppliers are indicated on the left. Customers are indicated on the right.

If necessary, tier 2 suppliers could also be identified, but the insight obtained might be of limited value to DB. Of primary concern at this stage is identification of the geographical location of DB’s main customers. Centre of Gravity (CoG) modelling might then be applicable, if determination of optimal facility location is required.
When the appropriate data is applied (such as trade volume between DB SR and its suppliers/customers), the channels of highest volume of exchange – implying functional criticality – will become apparent.
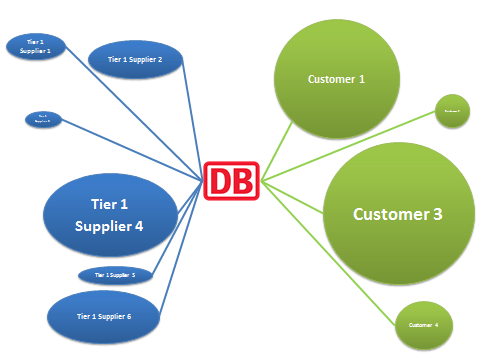
In terms of core functions/implied value-adding activities, a trade data-enriched diagram (below) will provide an at-a-glance overview.

The diagram above illustrates relative concentration of expenditure/volume of trade. Line length indicates the geographical distance DB and its suppliers, and distance between DB’s nearest relevant facility and the customer (or the customers’ main points of goods collection). Although more useful than the former for identifying key suppliers and customers, this diagram only reports relative concentrations of expenditure/trade volume and relative distances between DB and suppliers and its customers. It does not reliably identify value-adding activities. Such a diagram may however be useful when rationalising the location of facilities on the assumption that physical distance and cost/efficiency correlate inversely.
When suppliers are classified, e.g. Supplier 4 and 6 are classified as “Fleet”, and Supplier 1 and 2 as “Facilities”, the share of total supplier expenditure can be indicated (as percentages of total per annum supplier spend if necessary), and relative costliness thereby identified.
In the preceding example, Fleet expense is clearly greater than Facilities expense. Expense (low or high) might not be solely attributable to the centrality or value of the operation; other factors might be explanatory of trade volume. The cost of the trade, i.e. the transaction costs, if isolable, will be informative: when the cost of the trade is subtracted, the product or service cost will be visible. The value to DB of that product or service can then be evaluated, but it is the value of that product or service to DB’s customer that will be more revelatory of the key profit drivers. If the cost of a substitutable product or service is inflated by trade costs, a case for supply chain restructuring arises. Functionally unimportant, infrequent, but costly activities, such as livery swapping, must also be carefully treated in any analysis.
