Smartville: Extras (9)
The Nature of Supply and Demand: P to D Ratio

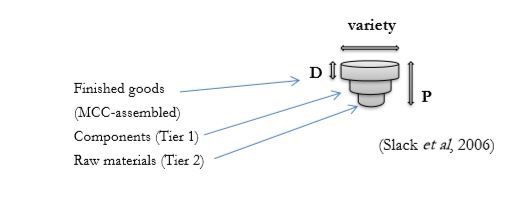
“P” = production lead time “D” = delivery time/ demand lead time (time customer will wait)
The above diagram is “Marshall’s Mushroom”. It illustrates P to D ratio. In the case of the Smart Car, “variety” can be substituted by “customization”; “P” represents how long MCC takes to complete one Smart Car; “D” is how long customers (the market) are prepared to wait to have their cars delivered. Because customization is available but restricted, low “P” and “D” lead times can be achieved. According to Mather (1988), “P” is ideally as low as possible.
As the diagram shows, there is a lower degree of variation in the raw material (Tier 2) and component (Tier 1) stages, and a higher degree at the finished goods (MCC) stage. In MCC’s case, “P” is theoretically 4.5 hours, but realistic lead times are 2-3 weeks. However, “D” exceeds the 2-3 week lead time, which allows MCC some slack and flexibility. It is also worth noting that in MCC’s case, the mushroom could in fact be inverted, since it is MCC’s partners who own the title and supply raw materials and components in modular form.
